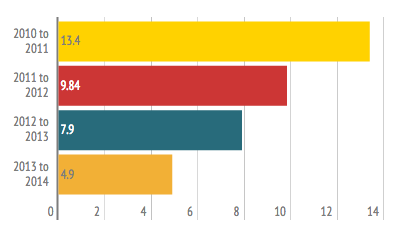
The UK has experienced positive growth in new business incorporations year-on-year since 2010, according to data from Company Check. However the rate of this growth has slowed, from 13.4% between 2010-11 to 4.9% between 2013-14.
The data, which reflects new businesses registered with Companies House, has calculated the total number of businesses incorporated in each year.
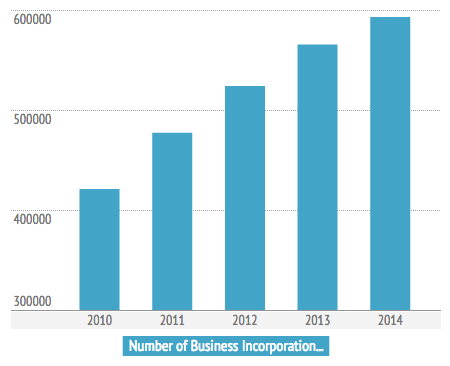
New business incorporations: Year-on-year growth
The UK’s economic growth was revised up in June this year, reflecting a healthier outlook for businesses as various industries, including construction, have outperformed expectations, as reported by the BBC. Small businesses contribute an estimated combined turnover of £1.6 trillion according to the Federation of Small Business and new business incorporations are therefore a huge part of our ongoing economic success.
New business growth has been consistently positive since 2010, with the number of new businesses incorporated growing from 420,994 in 2010 to 593,099 in 2014 (see below).
Embed this graph into your own website:
<a class=”embedly-card” href=”http://hub-new.companycheck.co.uk/wp-content/uploads/2015/07/growth-in-uk-business-incorporations-1.png”>Card</a>
<script async src=”//cdn.embedly.com/widgets/platform.js” charset=”UTF-8″></script>
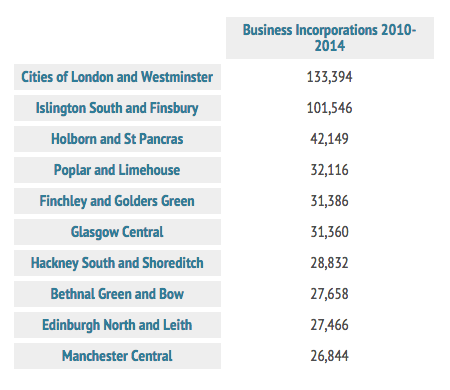
Perhaps not surprisingly, the areas of the country to have the most new business incorporations from 2010 to 2014 were in London, with the Cities of London and Westminster, Islington South and Finsbury and Holborn and St Pancras having a total of 277,089 new businesses incorporated between them in the four year period. Outside of London, Glasgow Central and Edinburgh North and Leith were also among the top-10 areas of the UK by number of new business incorporations between 2010 and 2014, with 31,360 new business incorporations in Glasgow Central in this period and 27,658 in Edinburgh North and Leith.
The top ten constituencies by number of new business incorporations between 2010 and 2014 are shown below:
Embed this table on your own website:
<a class=”embedly-card” href=”http://hub-new.companycheck.co.uk/wp-content/uploads/2015/07/incorporations-uk-2010-2014-1.png”>Card</a>
<script async src=”//cdn.embedly.com/widgets/platform.js” charset=”UTF-8″></script>
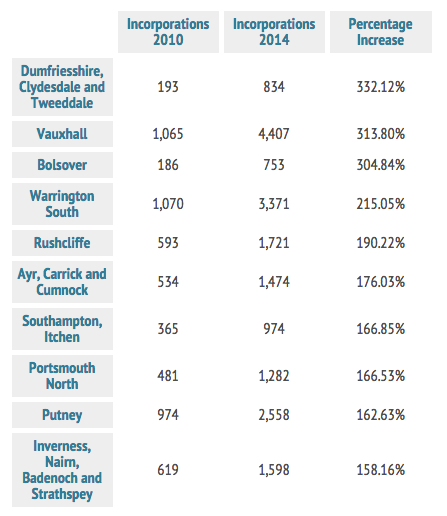
The top performing constituency by percentage increase in business incorporations in the 2010-14 period is Dumfriesshire, Clydesdale and Tweeddale, where business incorporation rose by 332% from 193 in 2010 to 834 in 2014. Vauxhall in London went from 1,065 business incorporations in 2010 to 4,407 in 2014 – a percentage increase of 313%. The top 10 constituencies by percentage growth in business incorporation are shown below:
Embed this table on your own website:
<a class=”embedly-card” href=”http://hub-new.companycheck.co.uk/wp-content/uploads/2015/07/incorporations-uk-2010-2014-1.png”>Card</a>
<script async src=”//cdn.embedly.com/widgets/platform.js” charset=”UTF-8″></script>
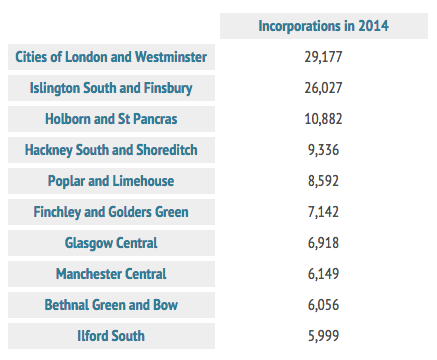
More recently, the top performing constituency by number of business incorporations in 2014 is Cities of London and Westminster, with 8 of the top 10 constituencies by this criteria being in London:
Embed this table on your own site:
<a class=”embedly-card” href=”http://hub-new.companycheck.co.uk/wp-content/uploads/2015/07/business-incorporations-2014-by-constituency-1.png”>Card</a>
<script async src=”//cdn.embedly.com/widgets/platform.js” charset=”UTF-8″></script>
Business incorporations: Percentage growth slows
While the number of new businesses incorporated has grown, the percentage growth from year to year is actually slowly, according to the data. The percentage growth in total incorporations between each year is shown below:
Embed this graph on your own site:
<a class=”embedly-card” href=”http://hub-new.companycheck.co.uk/wp-content/uploads/2015/07/business-incorporations-percentage-growth-2010-2014-1.png”>Card</a>
<script async src=”//cdn.embedly.com/widgets/platform.js” charset=”UTF-8″></script>
Data source
This data has been collated by Company Check, the only service which provides a comprehensive search and credit details on companies and directors across the UK and Europe. Company and director details comes from Companies House and reflect the most recent accounts filed by the company, in this data 2014.
The yearly incorporation numbers reflect each calendar year from January 1 to December 31.